Vibration signal Recorder
How a technology believed to be obsolete is being used again.
WHEN taking measurements and analysing vibration directly on site, we can find ourselves in situations where time does not permit us to try different types of measurements with different parameters. The reason is that the machine's running time is too short to take measurements repeatedly.
Run-up and coast down are typical examples of this situation. The risk of setting the measurement parameters inappropriately or making a mistake in the set-up phase can be quite high, especially with the added pressure of knowing that the measurement cannot be repeated.
My personal experience was when we were asked to measure explosion vibrations in a quarry. Preparation had taken all day due to the sheer volume of explosives involved. In addition, the measurements had to be taken synchronously from many sensors placed in different locations at different distances from the point of detonation.
The required measurement report had to include a time waveform from each sensor and a graph showing the energy decay curve as a function of distance from the detonation centre. We had set up the amplitude trigger so that the wave from the detonation arriving at the first sensor would start the measurement.
Of course, we had used a pre-trigger (250ms) so that we could see the noise just before the detonation. We were all nervous as we counted down to the detonation; we held our breath and the explosives were detonated.
Troubles Ahead
As soon as we saw the signal, we knew something had gone wrong. There was not the expected low noise at the beginning of the sudden increase in blast energy. There were high blast amplitudes from the beginning of the measurement (including the first sample) and they were decreasing over time.
Something had gone wrong. With trembling hands we opened the analyser's setup menu and immediately realised what had happened. Instead of a 250ms pre-trigger, we had set a 250ms post-trigger!
We had lost the entire beginning of the detonation signal and the measurement had started 250ms after the wave had reached the sensor. This meant that we could not do the analysis that our customer wanted.
Believe me - it was very difficult to explain to the customer why we could not do the analysis. When we jokingly suggested that we try the detonation again, the customer did not find the idea funny at all. This was an example of a perfect situation where the whole event should have been recorded and analysed afterwards.
In this case, the recording would have been started manually and allowed to run for perhaps a few minutes before the detonation of the explosives and then stopped manually. This would have eliminated the need for the pre-amplitude trigger that led to the disastrous experience described above.
Another situation where it is better to record the raw signal is when measuring a machine that is constantly changing its state. This can be caused by changes in power or other similar conditions. An elevator motor is another example; first there is a short run-up, then the elevator runs continuously for a while, then it stops.
The whole cycle may take only a few seconds. It is better to record the whole cycle and then select the required part and analyse it. The recording may also be required when collecting the route. All the necessary vibration measurements (e.g. total values, spectrum and time waveform) can be processed later on the computer from the record.
The history of the tape recorder
When I started working in vibration analysis a long time ago, in the 1980s, tape recorders were used to record signals. In those days they were huge and heavy, so you needed a strong man to carry them around. A separate "analyser" was needed to analyse the recording. This was even bigger and heavier than the tape recorder!
In the 1980s, the first "portable analysers" appeared on the market and revolutionised the field of vibration analysis, especially for route measurements. Tape recorders were quickly abandoned as all readings could now be stored in the memory of the portable device. The readings were stored, but not the raw record.
The processors were too slow to record the raw vibration signal, and the memory was too small to store such a large amount of data. For those who are much younger than me, the hard drive in my PC in 1990 was an impressive 10MB. Since it was impossible to store a large file, I always had to consider the trade-off between storing 400 or 800 lines of resolution in the vibration spectrum, and storing higher resolution was only done in very special circumstances.
Nowadays, when storage capacity seems to be unlimited, it is very difficult to explain to a customer that 25,600 lines in spectrum is not necessary. Their response may be that it does no harm to save the spectrum with more lines.
This is true when we are talking about route measurement, where readings are repeated at long intervals such as days, weeks or months. However, when we start thinking about online monitoring, the situation changes dramatically. If you set up a 25,600 line spectrum on dozens of channels and take readings every second, even today's conventional memory discs can fill up very quickly.
During those early years, I often wished that I could have implemented a version of the "tape recorder", so that when I was back in the office, I could refer to it when I discovered that my setup in my portable analyser would be different if I had the chance to do it all over again. As a vibration equipment manufacturer, we have patiently waited for processor power and memory size to improve to the point where we can consider adding recording back in.
"Tape recording is available again."
The Adash VA4Pro recording module was later developed and the "digital tape recorder" is a reality again. The "recorder" is one of the many modules included in the analyser. To use the recorder, the first task is to set up the channels we want to record from.
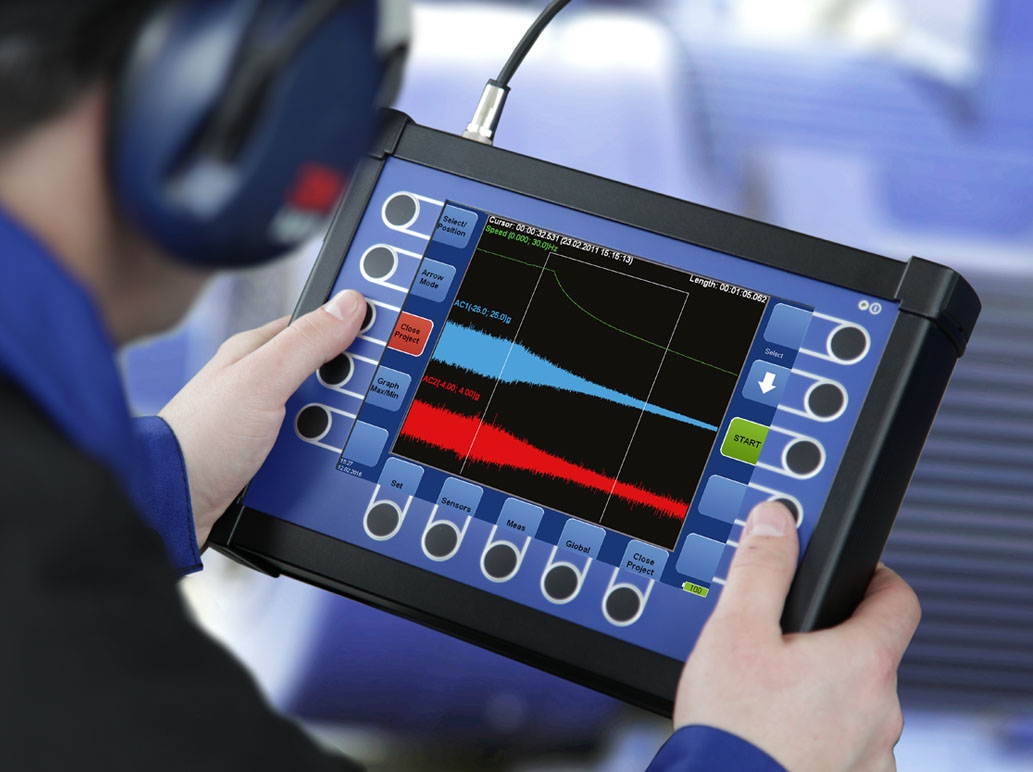
We can record 4 AC and 4 DC channels simultaneously. If we are using an eddy current (proximity) sensor, we connect the sensor to the AC and DC channels in parallel. We can record the AC signal for factors such as orbits and the DC signal (gap) to get the centre line. Due to the large amount of memory available, the recording length does not need to be defined before recording. Recording is normally started and stopped manually. Recording can also be triggered (started) by an external TTL signal, so that recording starts when the signal is detected and stops when the signal disappears. Because of the high processor speed and memory available, a sample rate of 64kHz (25kHz frequency range) is commonly used, although during post-processing much lower frequency and resolution settings are usually sufficient for analysis. The fs=64kHz sample rate provides an amazing 160 hours of single channel recording time, or over 32 hours of continuous recording using all four channels and a speed sensor input. Once recording is complete, the signal is displayed on the screen. You can then select what you want to save and delete the rest to minimise unnecessary memory usage.
Post-processing the recorded raw vibration signal
THE TWO MODES most commonly used to post-analyse the recorded raw signal in Adash instruments are the Analyser and Run Up/Coast Down. You can post-analyse immediately after recording in the field or at a later date in the office. The Analyser mode offers a wide range of readings: simple ( overall value, commonly used ( time signals, spectrum) or more advanced readings (frequency response).
Run up/coast down mode allows you to continuously measure and store readings. This means that you can set the time interval between two measurements (example: the measurement is taken every second) or the interval depends on the speed change (the new measurement is taken when there is a speed change of more than 1 Hz from the previous stored measurement).
You can make time run faster...
For example, if the record of the run-up is 20 minutes long, the post-processing in normal mode will play back in real time (20 minutes). This creates a situation where it is as if you have gone back in time and are doing an evaluation right next to the machine, but you have the advantage of being able to replay it multiple times with a different setup until you have analysed the data at the optimum resolution and frequency.
If you do not want to wait 20 minutes to analyse the data, we have developed a very unique feature - the time can run faster. For example, a minute can be reduced to just one second. This is achieved by special block data access and a bulk current evaluation algorithm.
The speed-up of time is inversely proportional to the complexity of the analysis required. In the case of processing simple readings such as overall values, we can even make the time 1000 times faster (this means that 1 hour of recording is processed in 3 seconds). In the case of processing more complex readings, such as order analysis, which requires a relatively long computing time, we can typically only make the time 50 times faster.
The big advantage of this feature is that it gives the user the freedom to try different setups and see the different results in a fraction of the time. It allows the analyst to 'experiment' as if they were in the field and repeat the data collection process on the equipment.
Virtual vibration analyzer unit in the computer
So far we have talked about using an instrument for vibration recording and also for vibration analysis. However, there are other possibilities: RECORDINGS - can be easily transferred from the instrument memory to the computer (via USB cable).
The VA5Pro analyzer app is available to download and run on your PC or Tablet. This is the Virtual Unit VA5Pro software and can be downloaded free of charge from ww.adash.com.
This software is a fully functional version of the firmware that runs on the VA5Pro unit. Once the virtual vibration analyzer is loaded onto your PC, you will see the same screen as the VA5 Pro analyser. It allows a potential customer to work with a virtual version of the VA5Pro analyser.
WITH THE RECORDING FUNCTION, YOU WON'T MISS ANY IMPORTANT INFORMATION HIDDEN IN THE VIBRATIONS.
As a result, we quickly saw the benefit of being able to process the stored recordings made in the VA5Pro on a PC. Although using a mouse and keyboard (or a touch screen if using Windows 8 or 10) makes this process much faster and more user-friendly, the main advantage is the superior processing speed and power of most PCs compared to the CPU in the Adash VA4, resulting in even faster analysis time.
Share Your Records
The simple Explorer-based file architecture allows you to export your recordings in .wav format and share them with colleagues for use with different software platforms. Although you can play the .wav file through your computer's audio output and then connect the analyser for analysis, this is not the best solution as the frequency range starts at over 20Hz. The conversion from digital to analogue is not without its problems, but it is better than nothing.
However, Adash offers a much more elegant solution for sharing recordings with colleagues who do not have the VA5 Pro analyser. Remember - a fully functional version of the VA5Pro vibration analyzer can be downloaded free of charge from our website.
Once downloaded to your PC, the recorded raw data files can be shared and analysed by anyone without restriction. This can be a very powerful tool if the data is collected (or more accurately recorded) in one location but analysed by different analysts who may have different perspectives on what is of interest; then the results are collaborated and discussed.
The SAB (Signal Analyzer Box) connected to a laptop or tablet is then the same as the VA5 Pro analyser.
We don't necessarily need the VA5Pro to make the recording. The Adash SAB (Signal Analyzer Box) is available and has the same AC/DC inputs as the VA5 Pro. Simply upload the licence file corresponding to the SAB 4 channel module into the Virtual Unit, then connect the SAB to the laptop or tablet via a standard USB and your PC or tablet becomes a 4 channel analyser with all the features of the VA5.
Many users prefer this alternative as it is much easier to control and can be shared with others in real time using the wireless and remote desktop connection. This application also offers the unique ability to "stack" up to four SAB units, turning your PC into a 16-channel monitor! The small SAB units are much cheaper and easier to ship, and can be more conveniently carried in a backpack with a few sensors and cables, rather than the burden of a large hard carrying case and all the necessary accessories.
What about the future, recording only?
The possibility of recording is also available when collecting route data. This means that in addition to the usual route readings ( overall, spectra...), you can also make a recording for post-analysis. And what is our vision for the future? Why should we take common readings such as overall values or spectra on the route?
Why don't we just record the raw signal and do all the analysis later in the computer interface? We have been considering these futuristic visions in our company for some time. It is obvious that there will be opponents who will say that they need to see the results of the measurements in the field, which is true for the analyst.
On the other hand, there are companies where the routes are taken by technicians or even operators who don't know much or anything about vibration. In this case a recording is a better solution, if technically feasible, because the "remote analyst" has more options. He/she can review the data as in the standard route mode, but also has the option of post-analysis in higher resolution. We have been cooperating with our customers in the nuclear power industry for a long time to develop this condition monitoring platform. There are thousands of measurement points on the site, but only 2 vibration specialists to analyse the data. In this case, they could not manage to take all the readings, so the maintenance personnel have simple data collectors to record the data, and then the vibration specialists can do the post-analysis. If more advanced data acquisition is required, the vibration specialist would use advanced analysers and leave his desk.