What is frequency response function (FRF) - simple explanation
21.06.2022
In this video we will answer one question - what is the frequency response function? Why is it useful?
We begin with simple example:
We have the black box, which has 1 input and 1 output connector. We don’t know, what electronic is inside. We can just send the input signal in and we can measure, what happens on the output.
For simplicity we will use just DC voltage as input signal. For example 1 Volt. We send it to the input.
And from the output returns 2Volts.
It means that the box gains two times.
Now we send 10V to input. From output returns 20V.
The gain is again 2.
The value of the gain is the response function of the box.
We suppose that black box has the constant response gain. It means that the gain is the same for all values of input voltage.
If it would not be truth, then we get different response value for different input voltage. We will not analyze such boxes in this video. We suppose the constant response value.
Now we add the AC voltage to the input signal. For example 1Hz frequency. And again we can read the response on the output. For example we send in the 1V RMS and box returns 5V RMS.
The response gain is 5. Now we have the gain of DC, it is 2 and the gain of 1Hz, it is 5.
Now we can add next frequencies, 2Hz, 3Hz and next.
For example the last frequency will be 400Hz.
We measured all response gains. so we get one DC gain and 400 lines of AC gains from 1 to 400 Hz.
It looks like spectrum with 401 lines. That is truth it is very similar. And actually that is the frequency response function.
In next example we use the noise as input signal.
The noise has flat spectrum, it means the amplitudes are almost the same on all frequencies.
The equalizer is used as black box. We set one gain on 400 hertz and second gain on 4000 Hz. If we would have the mechanical structure then it would represent two resonant frequencies.
Now we can send the noise to equalizer and to the channel one of VA5.
The signal which returns from equalizer output we connect to channel two of VA5.
Now we set the frequency response measurement FRF. For this example with noise we can use standard hanning windows for both channels. We use also averaging.
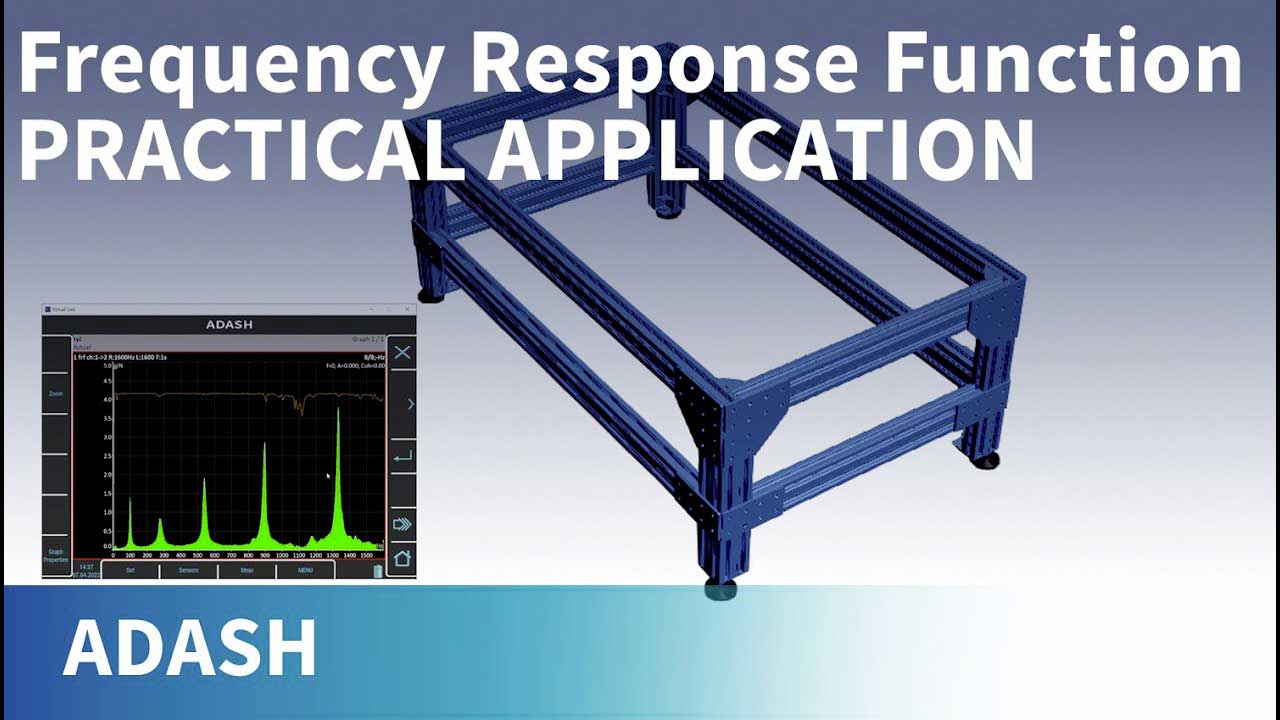
Now you can see the result. The response graph has the same shape as we made on equalizer. On Y axis we can see the gain levels for every frequency.
Now please note this line. It is the coherence function. You can see that it is constant for all lines, it means all frequencies. The value is equal one, but do not be confused, that on Y axis is different value. The Y axis is used for response values. We would have to draw the second Y axis for coherence. The coherence is constant and equal one because the response of the equalizer box was the same for all measurements in averaging. It means the response was stable.
If the response of black box is not stable, then coherence decreases to lower values. If the response is random, then coherence is zero. In means there is no relation between input and output.
One simple example. I change the gain of 400Hz for every measurement in averaging.
We can see the result. The coherence drops down. The response was not stable.
In next example we disconnect the equalizer output. It means the noise from generator is in VA5 channel 1 and random noise is in VA5 channel 2. There is no relation between them.
You can see that coherence drops to zero on all lines.
When we look at coherence only, we can see the amplitudes around zero.
If we look at response function again, we can see several resonances. But the coherence is almost zero. It means these resonances are just coincidence. If we will repeat the measurement again and again, we will get always the different result.
What does it mean for practical measurement? We can use only lines with high coherence. We can predict the response reliably only on this frequencies. The response on frequencies with low coherence is unpredictable and random and we cannot use it in practice.