Reveal Hidden Vibration Patterns - Autocorrelation in ADASH DDS
15.10.2025
Before we get to what autocorrelation is, we need to explain the basics of correlation.
In signal processing, correlation is a measure of how similar the shapes of two signals are.
A measure of this similarity is the correlation coefficient, which is a value always between -1 and 1.
The correlation coefficient is near 0 in this case, because the shapes are completely different.
If they are identical or similar, it is 1.
If one signal looks like a copy of the other and a constant is added to every sample of the copy,
or if every sample is multiplied by the same value,
the correlation coefficient is also 1. Correlation measures similarity, not identity.
If one signal is a mirror image of the other, it is -1.
Now, what is autocorrelation and how do we use it in vibration analysis?
Autocorrelation tells us how similar a signal is to a copy of itself shifted in time.
This also gives us a correlation coefficient, but it is not enough. In vibration analysis, we need a graph, not a single point.
Let’s explain at a simpler example. We get it by shifting the copy of our signal by
one sample and plotting the resulting correlation coefficient against time shift.
We then repeat this for time shift of two samples, three samples, and so on.
The number of times this procedure is done is equal to the number of samples of the original signal.
In the end, we get the graph of autocorrelation.
The time axis in the graph shows the shift between the original signal and its copy.
The vertical axis displays the value of correlation coefficient.
The coefficient is one at the beginning of the time axis, because the copy is not shifted and we compare identical signals. The value then decreases.
The power of autocorrelation is its sensitivity to periodic patterns in signals. Let’s look at the graphs:
the first one is the original signal.
The second one is its copy.
Let’s move the copy.
The periods in the original signal and the copy overlap at certain values of time shift. This results in higher values of correlation where this happens.
Autocorrelation makes the periodic nature of the examined signal more obvious, revealing
hidden periodic patterns.
Time Signal example
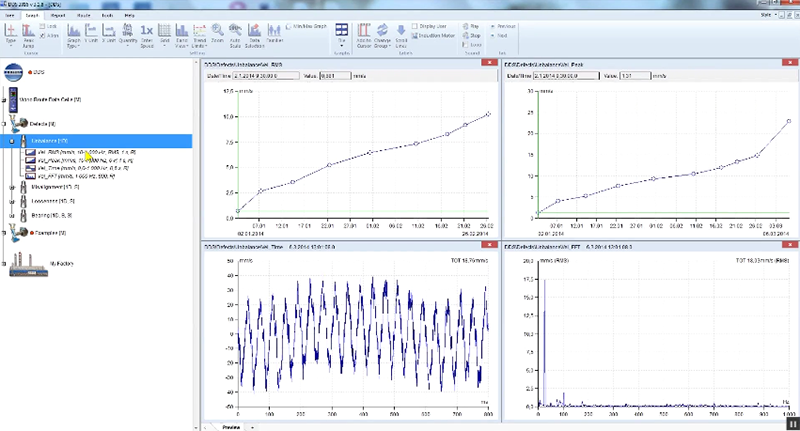
Let’s look at a time signal example and apply autocorrelation.
The machine this was measured at was unbalanced. The unbalance itself may not be visible in the time signal.
Now, if we turn on autocorrelation, it makes the effect of unbalance more apparent, showing an
obvious sine wave in the signal.
Bearing Demod-Time example
Autocorrelation may also be useful in evaluation of bearings.
This is what a demodulated time signal measurement of a faulty bearing looks like. The frequency of the fault present may not be visible at the signal or in
the demodulated spectrum.
But if we apply autocorrelation to this measurement, we see a sine wave in the demodulated time signal and the corresponding peak in the demodulated spectrum.